Letter From The Chair
LOU VESCIO, IBBA CHAIR
 The IBBA has been experiencing a banner year, and we are on track to make it one of the best in recent years. In addition to adding another great member benefit and having a tremendously successful Spring Conference, our internal statistics are improving greatly.
Financially, the IBBA revenues through July 2017 are over 9% ahead of revenues for the same period last year. More significant, our net income is over 28% more than the same period last year, which is remarkable.
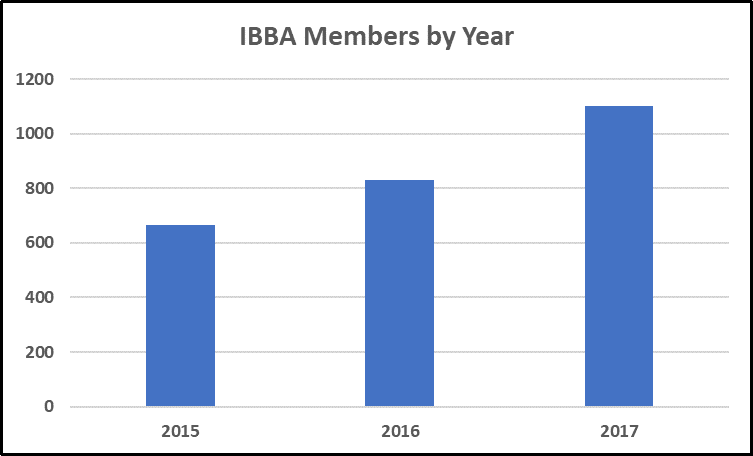
The number one driver of this success is our increase in membership – we officially passed the 1,000 member mark this August! From 2015 to 2016, the IBBA increased membership by more than 25%. From 2016 to 2017, our membership has increased another 32%, and we still have 4 months left in the year.
This growth can be attributed to our many committee members, not just on the membership committee, but to all the committees that help make this such a great organization. Credit must also be given to Kylene Gobluski, and her staff at allyAMC, our management staff. Our friends at allyAMC, along with our hard-working committee members, have come up with new, out of the box ideas that have helped expand our educational summit offerings and greatly improve our affiliate relations. Lastly, our Board of Directors have been very instrumental in steering this organization down the path of success.
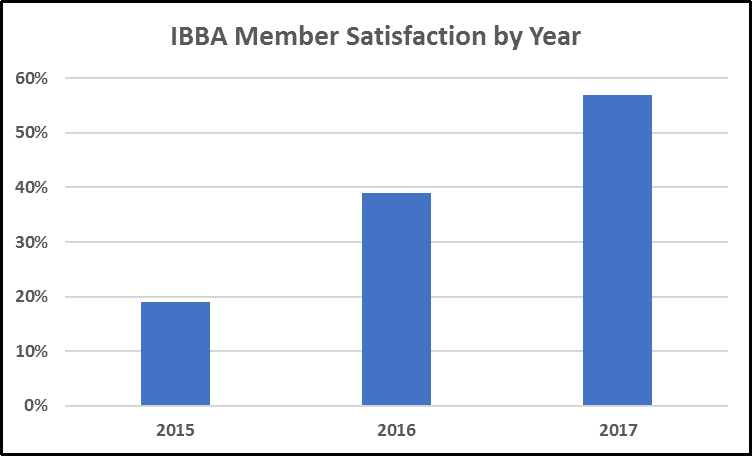
 Speaking of success, our latest member satisfaction survey indicates our membership also believes we are moving in the right direction. allyAMC implemented this survey in 2015 when they were hired by the IBBA to set a base line and gauge improvement each year. In 2015, we had a 19% membership satisfaction score. Considering the scores range from -100% to +100%, our score fell in a normal range. In 2016, we had a 39% membership score, which was a great improvement and a very good score. The really amazing news is that our membership gave us the 57% satisfaction score in 2017, which ranks us with some of the very best organizations in the country (Google ‘Net Promoter Score’ if you’d like to learn more about this survey methodology, and just how impressive a 57% score is.)
 As we enter the final months of 2017, I want to congratulate all our members for making this such a great organization. The IBBA is so important to all of us because the broker education, the networking opportunities, and the many fine friends we make across the world are key to our individual successes. It also helps us sell more businesses so we can make more money!
And we’re not done yet. We will be releasing some new online courses, benefits and resources yet this year, so stay tuned!
Continued success,
Lou Vescio, CBI, M&AMI, Fellow of the IBBA
Market Approach Valuation Resources
ANGELICA MICHAIL, CBI
 Experienced business intermediaries recognize that there are multiple methodologies to value a business and the different approaches available can yield different results. Understanding the purpose for the valuation is the starting point. For example, the value of a business for an IRS audit may be different from the value obtained for a divorce case. The scope, purpose and other factors will determine the type of valuation analysis and calculation undertaken. There are basically 3 business valuation approaches – Income Approach, Asset Approach and Market Approach.
For Business Brokers, the scope is often limited to determining the value of the business for a potential sale and the purpose is limited to calculating the asking price in the current market. This is often referred to as the Broker’s Opinion of Value, aka Most Probable Selling Price. The Market Approach is preferred by many business intermediaries as it derives valuation data through comparisons to similar businesses previously sold.
Main street business sales are generally Asset Sales where the sale price typically includes FF&E (Fixtures, Furniture and Equipment), inventory and Goodwill. Upon receiving the financials, a business intermediary is positioned to recommend a sales price, leveraging the variety of resources available to the professional broker. For Market Approach assessments, these sources provide ratios such as Price/Revenue, Price/SDE, Price to EBITDA; multiples that are often utilized when pricing a business for sale. With the extensive data provided, additional ratios may be analyzed for a more comprehensive analysis but in this article, only the 3 ratios are considered as a general way for determining an indication of value for a business.
Sources of Information available to business brokers:
- Business Reference Guide – This guide which is available online and in print, contains Rules of Thumb for pricing about 700 businesses (searchable via SICS and NAICS Codes). It has been around for more than 20 years. The Rules of Thumb are derived from industry experts such as business brokers, accountants and valuation specialists who have a good feel for what the market is willing to pay for businesses in those industries. Some brokers use this guide to quickly price a business. Others use it as an additional pricing resource, along with pricing obtained using one or more of the Databases described below. The rules indicate a Sale Price as a percentage of annual sales or multiple of SDE and EBITDA.
- BizComps Database – This online database was started in 1990 to provide information on small business transactions. Previously, there was no organized market data for small business sales. Since they were private sales, they were not publicly documented. Today, this database has accumulated over 20,000 transactions. It covers mostly main street business transactions and includes up to 21 data fields per transaction. BizComps sales are all asset sales, which is the norm for main street businesses. This database is often used for smaller deals. It includes both SICS and NAICS codes. BizComps uses the term Price as the actual sale price in $000’s where inventory has been deducted, if it was included in the sale price. The price excludes inventory so that has to be added in. Data can be filtered to consider only Asset Sales.
- Pratt Stats Database – This online database has financial details on about 27,000 private company sales with up to 149 data points. It includes about 900 NAICS codes and 800 SIC codes. This database is typically used for larger deals. Pratt stats uses the term MVIC (Market Value of Invested Capital) for the “Selling Price” and represents the over-all consideration for the business sale. It includes ratios for MVIC/NetSales, MVIC/Discretionary Earnings and MVIC/EBITDA. Data should be filtered for Asset Sales.
- IBA Market Database – This online database has the largest collection of small to medium size businesses with over 37,000 transactions in over 800 industries (SIC/NAICS codes). Over 2,500 are transactions over $1million and over 6,000 are sales from the last 5 years. Includes Price/Revenue, Price/SDE and Price/EBITDA ratios).
- PeerComps Database – Started in 1998, the database now has almost 10,000 transactions submitted by SBA lenders. Approximately 90% are asset sales. Average transaction size is $1 million, which is generally higher than BizComps and lower than Pratt Stats. Inventory is included in the multiples. Ratios shown are Price/Revenue, Price/SDE and Price/EBITDA. NAICS codes are used and a keyword can be used to filter the data.
We are fortunate to have a variety of databases available as sources of market comparables. Access to several databases to consider is advantageous, as the Business Broker can achieve a sufficient sample size to draw pertinent ratios from. Not counting duplicates for sources that may submit the same information to more than one database, there are about 100,000 completed transactions in all the above databases. The disadvantage is the underlying differences, such as source of data and terminology, requiring a Broker to make adjustments to accurately draw comparisons across these different databases. With the appropriate care in the use and analysis of the data when calculating the Most Probable Selling Price, using the Market Approach can be a very useful and powerful valuation methodology.
There are about 30 million small businesses in the United States. Considering the combined total comparable database count is almost 100,000 (not considering double or triple reporting which may occur for contributors to BizComps, IBA and Pratt Stats), we are still a long way from capturing many of the private sales of businesses that occur. Over time, and with continued reporting of small business transaction information, these databases will continue to grow, allowing our industry to have access to larger data sets.
Angelica Michail is the owner of Sunbelt Business Brokers of Pasadena. Angelica has earned the designation of Certified Business Broker (CBB), Certified Business Intermediary (CBI), Certified Valuation Analyst and Certified Franchise Consultant (CFC). She brokers small business sales and provides business valuation and business coaching for owners who plan to sell their business in 2-5 years. She is currently the Co-Chair of the IBBA Marketing and Communications Committee and a member of the M & A Source Communications Committee. Angelica can be reached by email at [email protected].
3 Current Market Trends
LISA RILEY, CBI
 As we are all aware, a business is only worth what someone is willing to pay and what someone is willing to sell it. Sometimes that someone is a willing buyer/seller; sometimes there is a compelling reason to buy/sell that will increase or decrease the worth. The reason may be cultural or due to an illness, move, or change in life. Three questions that are addressed from the Q2 2017 Market Pulse Report and from a combination of prior reports:
- Do advisors believe it is a Sellers’ or Buyers’ Market?
- Of the Asking Price, what percentage is actually paid?
- Finally, what is the Median Multiple based on Sale Price?
Looking at past trends provides an indication of what is coming. Using the quarterly IBBA and M&A Source Market Pulse* results for the past 4 years, Intermediaries perception is that the market may be shifting. Although Main Street (<$500K to $2MM) has been seen as a Buyers’ Market, the sentiment is becoming much stronger with only 1 in 4 advisors (<$500k) reporting it is a Sellers’ Market. On the other hand, the Lower Middle Market ($2MM-$50MM) remains a Sellers’ Market with approximately 7 in 10 advisors reporting such. However, this is the first dip when comparing year over year trends for the past 4 years where the number advisors reporting that it was a Sellers’ Market declined across all segments.
Sellers’ Market Sentiment Declining
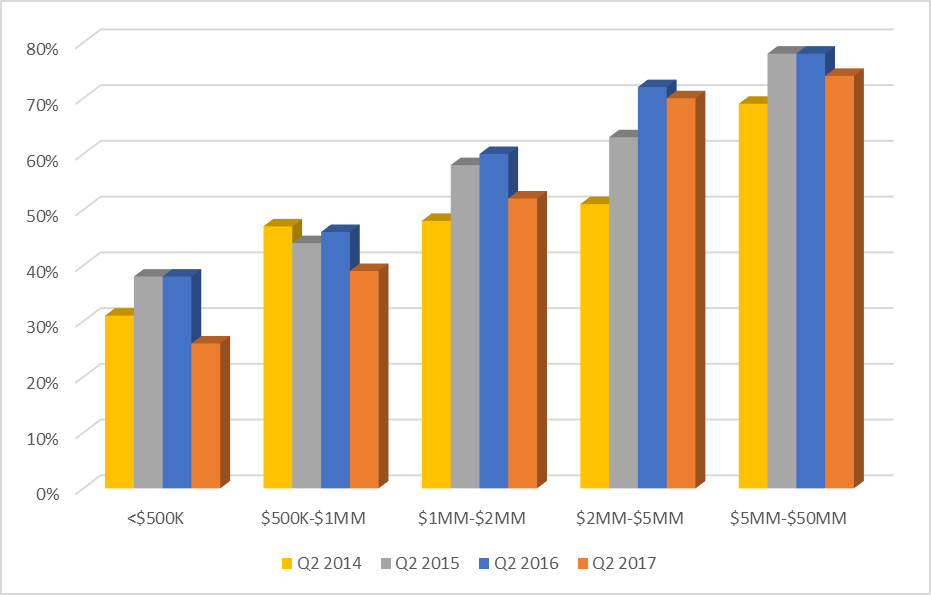
This may not be surprising given the number of businesses owned by Baby Boomers which has been heralded for the past several years as leading to a massive transition in ownership. The more businesses available, the stronger the likelihood of a Buyers’ Market across all segments.
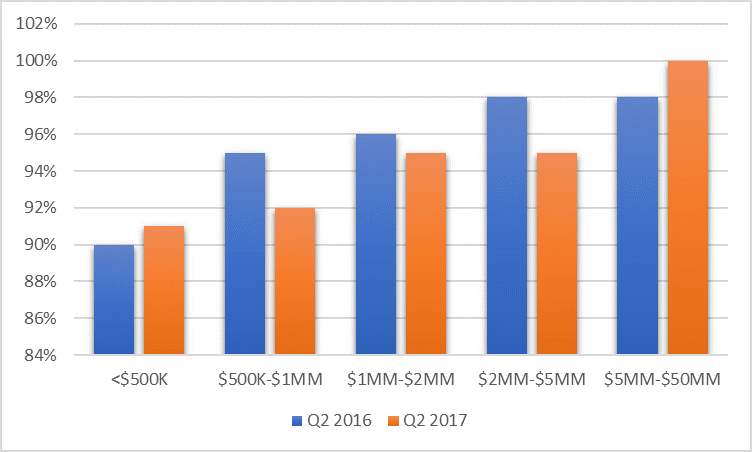
Participating Intermediaries reported lower finalized prices in relation to the asking price. Taken together with the small decline in Seller Market Sentiment in such an important sector of our small business economy, this may be an indicator of uncertainties in the future. Although Final Price ranged between 90% and 100% of asking price year over year, in the $500K to $5MM range, the Final Price dropped slightly compared to the Asking Price.
Final Price Realized vs. Asking Price
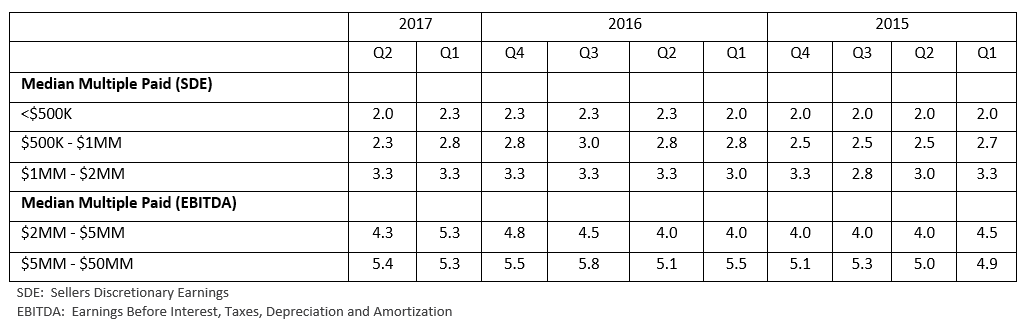
Multiples remain fairly strong, with declines back to Q1 2016 levels for the smallest Main Street segment and not seen since Q1 2015 in the $500k-$1MM Main Street segment. Year over Year multiples for both Lower Middle Market segments showed gains, however, the $2MM-$5MM showed a 1 point decline from Q1. Simply stated, if a business had $500,000 in EBITDA and the Q1 2017 price at a 5.3 multiple was $2,650,000 whereas in Q2 2017 it was $500,000 less at $2,150,000 on average.
Median Multiple
* The IBBA and M&A Source with the support of the Pepperdine Private Capital Markets Project and the Graziadio School of Business and Management at Pepperdine University has conducted quarterly Market Pulse Reports since Q2 of 2012 to gain an accurate understanding of the market conditions for businesses being sold in Main Street (values $0-$2MM) and the lower middle market (values $2MM -$50MM). For the most recent and prior reports, please go to: https://www.ibba.org/resource-center/industry-research/.
Lisa Riley is the Owner and Designated Broker at LINK Business-Phoenix in AZ. Lisa is a Certified Business Intermediary [CBI], a Certified Business Broker [CBB], PhD, Chair of Market Pulse Committee and Board Member of the International Business Brokers Association [IBBA], Vice President of the Arizona Business Brokers Association [AZBBA], as well as a former business owner and university professor. She can be reached at 480-686-8062 or [email protected]. LINK Business-Phoenix provides services for business transitions from valuation throughout the sales and transition process to final sale/exit or acquisition. LINK Business is an International Business Brokerage Franchise providing business intermediary services with locations throughout the United States, Australia, New Zealand, South Africa and the Philippines.
Upcoming IBBA Learning Webinars
How to Maximize Opportunities for Business Brokers to Sell Businesses to International Customers
October 11, 2017
12 pm EST
In this webinar, Andres Rojas of the Calderaro Tyrrell Law Group will explain different visa types and cases tailored to maximize the knowledge in business immigration law while creating opportunities for Business Brokers to close more international customers.
Is Inventory Included in the Valuation and Sales Price?
MICHAEL FEKKES, CBI, M&AMI
 This is most likely not the first time a business broker has seen this question. While most valuation and recasting elements of our profession are very straightforward, how inventory is incorporated in a valuation and business sale varies considerably. This is an issue where the phrase “it depends” is appropriate.
The guidelines and considerations for addressing inventory can be different depending on the industry, type of business, and amount of inventory involved when both valuing and selling a business.
In asset sale transactions, the most common structure is for the seller to retain cash & accounts receivable, satisfy accounts payable and transfer all assets free and clear of any liens/encumbrances as of the day of closing. The buyer typically acquires all assets necessary to operate the business and these are normally included in the multiple of adjusted earnings derived through the Income Approach valuation method. Valuing a business via a multiple of adjusted cash flow has little relevance unless it is accompanied with a breakdown of those assets which are included in the sale. Setting aside for now, those industries where inventory is significant in terms of value (jewelry stores, automobile dealers, grocery, liquor, etc.), a buyer should expect to receive some component of inventory included in the transaction price. Ultimately, the formula and structure needs to pass a reasonable person test and business inventory can be a grey area for many practitioners in our industry. Determining what an average amount of inventory is for a particular business can be established through inventory reports, historical sales, and balance sheet data.
Lender financing is often utilized to fund acquisitions and in these situations, it will be important for the transaction to cash flow for the buyer. For certain transactions, the value of inventory is very high in relation to the value of the business and it might be challenging for the buyer to cash flow the transaction if all inventory was included. A calculation for “excess” inventory may be warranted, where a normal amount is included in the multiple and an excess component is added to the purchase price.
When preparing a business for sale it is important to evaluate the numbers from the standpoint of the buyer’s post transaction cash flow analysis. Based upon historical cash flow, sales price, and amount being financed, can the proposed transaction enable a buyer to obtain financing based upon prevailing loan packages? The post debt service cash flow must be adequate for the buyer to live on. For some transactions, the total amount requested to pay “for everything” could be untenable from a buyer cash flow perspective.
Selling a business involves a number of challenges and mitigating known obstacles upfront will provide an easier path for all parties to complete the transaction. Inventory should never be a stumbling block to closing a sale. For businesses where excess inventory is present there are a number of solutions available. A couple of examples, include:
- Seller consign the excess inventory to the buyer (pay as sold basis)
- Current owner sells off excess inventory prior to transaction. (Depending upon how this is executed, it could be potentially detrimental to the new business owner should products be sold at below market rates to established clients).
In a perfect world, brokers and sellers should be performing a comprehensive assessment of inventory before listing a business for sale. Understanding the quality of inventory under roof and determining if the quantity is in balance with historical sales are worthwhile exercises when evaluating a business for sale.
Determining the following ratios and inventory characteristics at an early stage will pay dividends down the road for all parties:
- Turn Rate – both historical to the business and a comparison to the industry.
- Number of SKU’s – understanding the top sellers and poor performers.
- Salable/Obsolete – damaged, seasonal, obsolete.
- Cost – prevailing market cost vs. cost on the books.
This assessment process enables all parties to have an accurate depiction of the key product sales and the appropriate inventory that should be held by the business. Performing this process early in the engagement enables all stakeholders (seller, buyer, lender) with time to make the logical decisions to correct any inconsistencies or develop solutions to handle excess inventory.
Lastly, there are a variety of industries that are valued differently, especially those that carry significant inventory. Some of the more notable examples include:
- Jewelry Stores
- Grocery
- Motorized Vehicle Dealerships (used)
- Liquor Establishments
- Large Apparel Stores
For brokers who have expertise in these markets, it is generally understood that not all of the inventory is included in the valuation multiple. In some cases, none of the inventory is a component. For these situations, it is acceptable for the inventory (some or all) to be added on top of the industry specific multiple used in the valuation. Discussing specific valuations is tangential to this article so it is advised that the traditional professional resources are utilized by the advisor to properly value these inventory intensive businesses.
Getting lenders onboard early is recommended. According to Steve Mariani, President of Diamond Financials Services, when considering larger inventory levels and maybe even excessive, this value in the transaction is sometimes shared amongst buyer, seller and lender. Meaning that first we must determine usable inventory and turn rates as the above describes and then back into the amount that CAN be included in the transaction that still allows for correct lender coverage ratios and an ultimate financing approval. This “acceptable amount” must also allow for the correct operation of the business and not leave a buyer in need soon after closing unless the appropriate amount of operating capital was included for the replacement purpose.
It is clear there are a myriad of considerations addressing the inventory issue in a business for sale. The goal of this article was not to provide a solution or valuation methodology for each industry or specific circumstance but to address some of the avoidable pitfalls related to this topic. Having a large inventory, in some cases, has clear logic behind it and advantages to the buyer, who acquires it. In most cases, it comes down to what the buyer and markets are willing to accept as market changes and cash flows ultimately determine the final selling price. Performing an assessment of the inventory make-up, comparing with industry guidelines, and developing creative solutions to satisfy the goals of both the buyer and seller are recommended to achieve a successful transaction.
Michael Fekkes is a Senior Broker at ENLIGN Business Brokers in Nashville, TN. Michael is a Merger & Acquisitions Master Intermediary [M&AMI], Certified Business Intermediary [CBI], Chairman of the International Business Brokers Association [IBBA] – Communications Committee, as well as a former business owner. He can be reached at910.691.2202 or [email protected]. –ENLIGN Business Brokers is a Professional Services Firm serving the Southeast that is headquartered in Raleigh, NC providing business intermediary services ranging from valuation and sale to exit & succession planning strategies.
R-Squared and Business Comparables
Steve A. Mize A.S.A. with Douglas E. Teten
How to determine the credibility of data when using a comparable sales database?
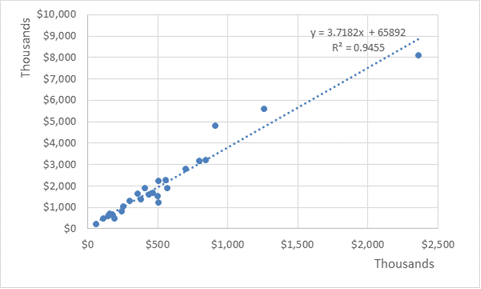 The R-Squared method compares a data set to the line of regression on a statistical chart. In this case, we plot PeerComps’ transaction set, against the linear regression representing the relationship between Price and EBIDTA.
The R-Squared function is score ranges from 0% to 100%, where 0% represents the lack of cohesion of a data set to its regression mean, and a score of 100% represents perfect cohesion. In business valuation, the industry generally considers an R-Squared of 75% and above as reasonable.
Above is a plot of PeerComps data comprised of all Medical Equipment and Supplies Wholesalers’ transactions (NAICS code 423450) between a revenue size of $1.0 million and $10.0 million. Typically, outliers are eliminated to avoid skewing of data, but since there were no significant outliers, no data points were eliminated in this study. Also, it is worth noting that all transactions are SBA approved, therefore eliminating the most outliers as a factor.
Here is where PeerComps scored:
- 94.5% when comparing Price vs. EBIDTA
- 95.2 % when comparing Price vs. SDE
- 64.2% when comparing Price vs. Revenue
When speaking with a client based on PeerComps data shown above, you can provide a valuation or price at approximately 95% accuracy based on EBIDTA or SDE. This also provides an explanation as to why a valuation based on revenue is not recommended is most likely misleading, as the empirical study shows that this market trades on multiples of earnings, and really cannot be gauged by the overall revenue with any certainty.
The R-Squared test is a function available in Excel (RSQ). I would challenge you to run this test of data cohesion on other databases. I have, and the clear winner is PeerComps. In other databases, I occasionally get a score in the 75% – 80% range, however in most cases to get there I would need to eliminate numerous outliers. I have found PeerComps to be more accurate, composed of reliable data, and as with the example above I did not have to remove or add any data points.
In conclusion, PeerComps allows you to accurately present your client a valuation based on actual market transactions with a significantly higher level of accuracy. The R-Squared study also helps you explain how the market trades, and the legitimacy of the valuation method. PeerComps has a track record of accuracy that is completely unprecedented, and superior to other comparable sales databases.
Steven A. Mize, is the Managing Partner at GCF Valuation, Inc. and PeerComps, Inc. Steve is an accredited Senior Appraiser with an extensive background in the business valuation. Please feel free to contact him with questions on this article or with any other business valuation questions.
Douglas E. Teten is a Valuation Analyst at GCF Valuation and a self-proclaimed data geek.
Get Connected to the IBBA!

 IBBA Magazine